One Version of the Truth: A Municipal Operations Analytics Platform on Microsoft Fabric
A mid-size Ontario municipality had five operational data sources — their financial ERP, a Cityworks work order system, a 311 service request platform, a tax and billing system, and dozens of department spreadsheets in SharePoint and Excel — none of which talked to each other. Finance ran budget reports from manual exports. Public works had no live view of open work orders. The 311 team couldn't surface service request trends without pulling raw data and rebuilding it in Excel every week. Leadership was making decisions from numbers that were weeks old and often contradicted each other depending on who you asked.
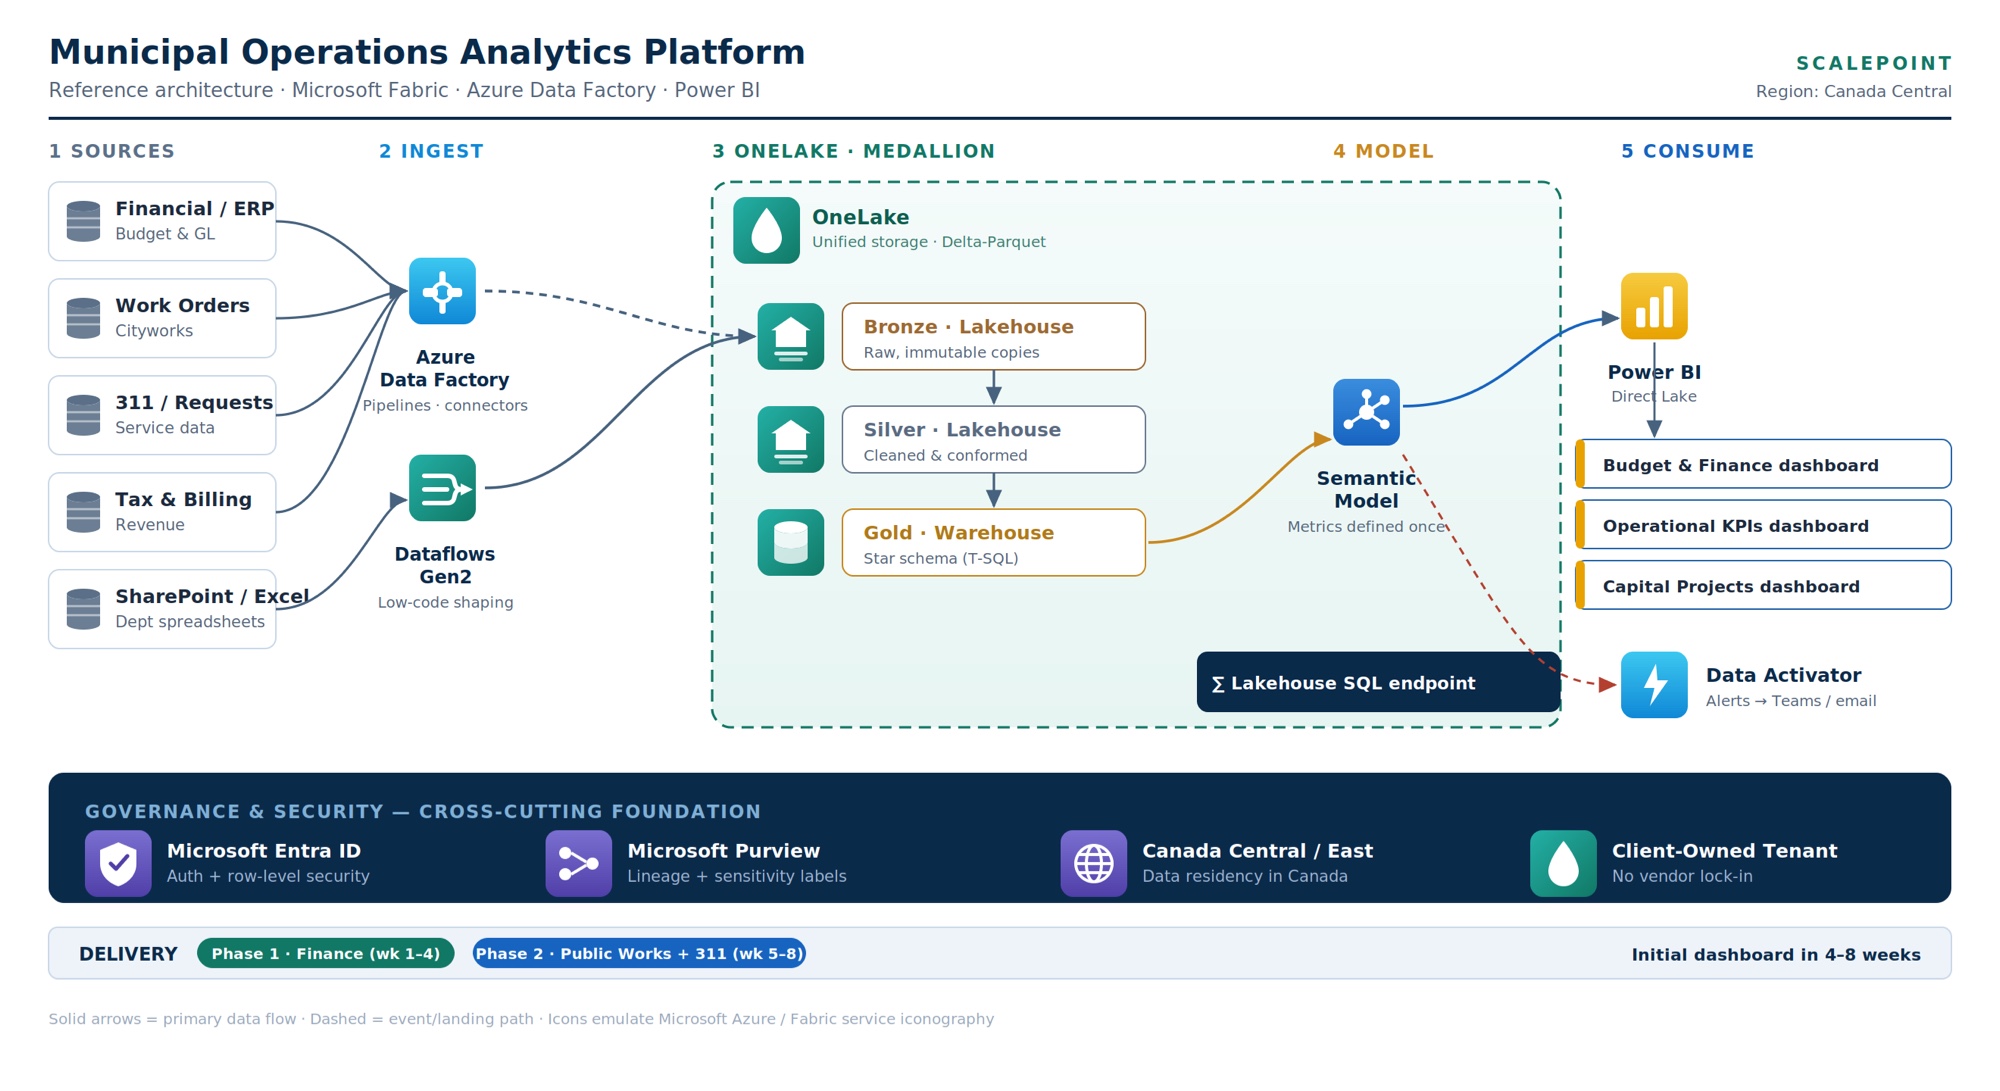
We designed and delivered a unified Municipal Operations Analytics Platform on Microsoft Fabric, hosted in Canada Central to meet data residency requirements — on the municipality's own tenant with no vendor lock-in.
All five source systems were connected through Azure Data Factory pipelines and Dataflows Gen2, landing raw data into a Bronze Lakehouse in OneLake. From there, data was cleaned and conformed in a Silver Lakehouse, then modeled into a Gold Warehouse using a star schema in T-SQL. A single semantic model sits on top — metrics defined once, used everywhere — connected to Power BI via Direct Lake for fast, live reporting.
We delivered three Power BI dashboards in two phases: a Budget & Finance dashboard and Operational KPIs dashboard in weeks one through four, followed by a Capital Projects dashboard and Public Works + 311 view in weeks five through eight. We also wired up Data Activator to send threshold alerts directly to Teams and email, so the operations team gets notified without needing to check a dashboard. Microsoft Entra ID handles authentication and row-level security, and Microsoft Purview tracks lineage and sensitivity labels across the platform.
Leadership now has a single, trusted number for every metric — budget vs. actuals, open work orders, 311 response times, capital project spend — pulled live from source systems. Department heads self-serve their own reports. The IT team owns the entire platform on their own infrastructure and Microsoft tenant, with no third-party analytics vendor involved. Initial dashboards went live in four weeks.